
We’ve all heard the rallying cry of the “One Metric That Matters”.
Choose your north star and focus. Grow 7% week over week. If you grow daily active users (DAUs), the rest will follow.
But blindly buying into the concept of the one metric that matters (OMTM) is a fatal oversimplification.
In a recent essay, Casey Winters, formerly Growth at Pinterest, says:
“The search for one key metric for a complex ecosystem like Pinterest over-simplifies how the ecosystem works and prevents anyone from focusing on understanding the different elements of that ecosystem. You want the opposite to be true. You want everyone focused on understanding how different elements work together in this ecosystem. The one key metric can make you think that is not important.”
In this blog post, we’ll expand on Casey’s points, walking through why focusing only on your north star metric is a dangerous way to measure the growth of your business, and how teams should think about setting their metrics instead.
4 Reasons OMTM is Misleading
Even the name “One Metric That Matters” is problematic. It sends the message that you only need to focus on one metric to drive growth into your product - this misleads many teams.
There are four key reasons that explain why buying into the one key metric philosophy can be deadly. Let’s walk through each reason in detail.
Good North star metrics are an output metric
When choosing which metrics to focus on, you must differentiate between output and input metrics.
Output metrics represent results and input metrics represent actions.

Output metrics help you set long term goals for the sustainable growth of your business - $6 million in revenue, 100k weekly active users, 1 million monthly active users, $10 million in MRR are all great examples.
Input metrics represent the actions that influence the output metric - 10,000 pageviews, 1,200 registrations, 700 upgrades from free to paid, for example.
You can’t focus exclusively on output metrics because they’re too big, too broad, and not actionable - they are a scoreboard. To win the game you need to focus on the individual plays that drive the score. Monitor output metrics to know how you’re doing, but build experiments around the input metrics you can directly influence.

Example: Spotify’s output metric
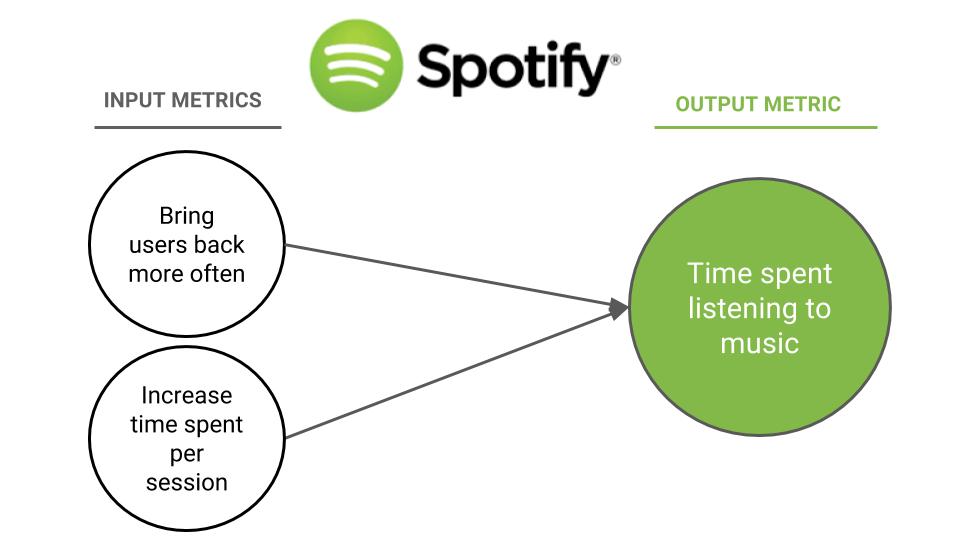
Let’s use Spotify as a hypothetical example. New users get the most value out of the app when they listen to songs, so a meaningful output metric for Spotify could be time spent listening to music.
If you were at Spotify and trying to come up with ideas to increase total time spent, you’d quickly realize that trying to brainstorm against time spent isn’t productive. It’s too all-encompassing. This prevents it from being actionable. Total time spent is the result of a set of actions. You need to determine what those actions are by breaking the metric down into layers of input metrics.
To do this you would ask yourself, “What actions could we take to lead to our users to spend more time consuming music?”
Two potential answers would be:
- You could bring the user back to the app more often and/or
- Get them to spend more time listening during each session
You could break those two options down even further. Identify the different actions you could take to increase your repeat usage rate or the amount of total time registered users spend when they do come back. This level of inputs is closer to the product, and therefore more actionable. The goal is to drill down to define more granular inputs and build experiments to move them.

Output metrics are a lagging indicator
Input metrics are leading indicators and output metrics are lagging indicators. By definition, it can take time for the output to reflect positive or negative changes in the inputs.
Output metrics can hide customer growth problems percolating under the surface. By the time the problem surfaces as poor results, and you recognize you have a problem, the damage is done.
Previously, we walked through how this can play out with a B2B SaaS company that focuses exclusively on MRR as their north star metric.
“Revenue retention is the output of engaged users. The usage is the input, and looking only at revenue retention has two big problems:
1. Revenue can hide what is going on under the hood with product usage, and shield you from signals about your product’s health over the longer term. You may earn a month or a year’s worth of revenue from a paying subscriber, but if that person isn't using the product, they will churn when that month or year is up.
2. If you are trying to improve retention but only tracking revenue retention, the game is over before you’ve even had the chance to play. Once a paying subscriber has churned, winning them back is almost impossible. If you want to improve retention you need to look at usage retention first.”
Let’s walk through another example to unpack this point.
An Analogy: The Ecosystem of the Serengeti
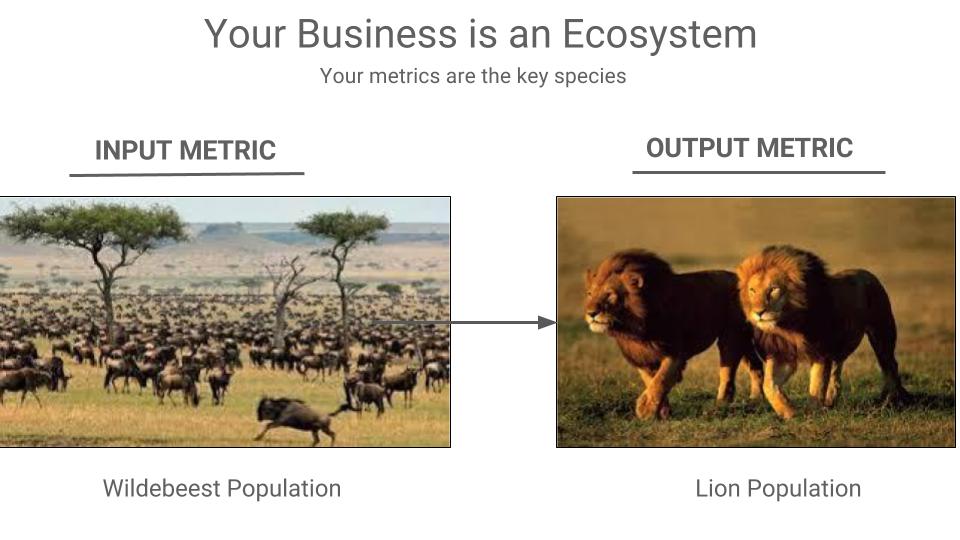
Pretend you’re an ecologist studying the health of the grassland ecosystem of the Serengeti. Since you know that lions are a keystone species, you focus on tracking their population. Let’s say, for the sake of this post, that the wildebeest is the lion’s predominant source of food.
But then, all of a sudden, a blight comes through and decimates the wildebeest population. If you weren’t paying attention to the wildebeests, you may not realize that the lions are in jeopardy - until it’s too late. They’ve started dying from starvation and you’ve already lost a lot of the population before you even realized there was a problem. (this is turning into a morbid analogy…but that’s the point!)
The health of any ecosystem can be understood by tracking the populations of different key species within the ecosystem and studying the relationships between them. The same goes for your important metrics. A company is an ecosystem and your metrics are the various species that make up that ecosystem. Just like you missed the signals that the lions were in danger, you will miss the signals that your north star metric is in trouble, if you aren’t tracking its inputs.
Get More Essays on Growth, One Email Per Post.
A single north star metric only captures one dimension of your business
Going back to the scoreboard analogy, optimizing against at a single north star metric is like looking exclusively at the score to get insight into how to win the game. Let’s say you’re a professional baseball coach - you’d also want to know the inning, numbers of balls, strikes, and outs, and the hits, errors, and pitch counts. If you only watch the score, you won’t know if you’re playing to win. You need to see how your team is performing across multiple dimensions of the game.
Similarly, because a single north star metric gives you insight into only one part of your business, you need multiple metrics to get the full picture.
There are multiple dimensions of a business that determine its health, and each should be measured by your key metrics. At a minimum, there are three key buckets for every product:
- Breadth of retention
- Depth of engagement
- Monetization
Shaun Clowes, VP of Product at Metromile and former Head of Growth at Atlassian, describes how his teams address the full range of these dimensions with their metrics:
“There's always a constellation of input metrics that we swap in and out under the umbrella of our output metrics, based on what we're learning at the time. The output metrics tend not to change much since they're valuable business outcomes, while the inputs change reasonably regularly. Though the output metrics don't generally change, from quarter to quarter, we may focus on different ones depending on what’s going on with the business.”
Constellation of Metrics

Examples of output metrics: Slack and HubSpot CRM
Slack
A key output metric for Slack is DAU. Though this reflects retention, it doesn’t reflect engagement, or monetization. Their DAU number could be increasing, but what if none of those users convert to the paid tier? Or they’re barely engaging with the product?
HubSpot CRM
For a team-focused product like HubSpot CRM, weekly active teams (WAT) could be a key output metric. Like DAU, it tells us how we’re doing with retention, but it doesn’t say anything about engagement or monetization. How active are those teams? Are they generating revenue?
A different kind of example: Pinterest’s output metric
In an effort to address multiple dimensions of the business, while still adhering to the philosophy of the OMTM, teams sometimes try to combine metrics. But this doesn’t work.
In his post, Casey walks us through the two issues that come from trying to consolidate metrics at Pinterest. He shares that at one point, in search of one key metric, the growth team combined two user actions - repinning (saving) and clicking content, into one north star metric. They called this a weekly active repinner or clicker, or WARC for short.
He says:
“[The WARC] ignores the supply side of the network entirely. No team wants to spend time on increasing unique content or surfacing new content more often when there is tried and true content that we know drives clicks and repins. This will cause content recycling and stale content for a service that wants to provide new ideas.”
Another issue revealed with the WARC metric was:
“The combination of two actions: a repin and a click… creates what our head of product calls false rigor. You can do an experiment that increases WARCs that might actually trade off repins for clicks or vice versa and not even realize it because the combined metric increased.”
Casey’s point here leads us to the fourth reason you should avoid the OMTM philosophy - the impact of “tradeoff metrics”.
North star metrics don’t account for the tradeoffs between metrics
Sometimes tradeoffs between metrics happen and you don’t realize it until it’s too late. You can’t just watch one of these tradeoff metrics; you need to watch both because as you improve one, the other might go down.
No metric exists in isolation. To truly understand how one single metric impacts growth, you need to see its effects on other metrics downstream.
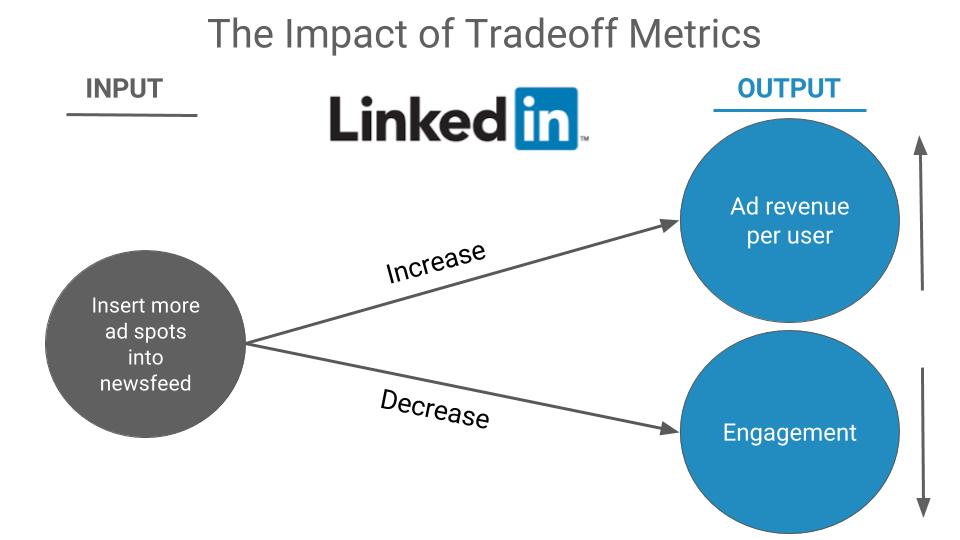
Example: Tradeoff metrics at LinkedIn
Let’s say you’re on the growth team at LinkedIn and one of your big goals is to improve ad monetization of the news feed. You might choose ad revenue per user to be your north star metric. To increase that number you could insert more ad spots into the news feed. But there’s an implicit problem with this - it would likely come at the cost of long term retention and/or user engagement. If the team were to optimize exclusively against ad dollars, unchecked by retention and engagement metrics, this would kill the the news feed, and possibly the rest of the product.
The Right Way to Set Growth Metrics
For all the reasons we walked through above, focusing on one north star metric to grow your business is a dangerous proposition.
Here’s what to do instead:
1. Select a constellation of metrics
Select a constellation of a few key output metrics that capture the full dimensions and core value of the business. Make sure they account for retention, engagement, and monetization, and then monitor the full scoreboard.
2. Break your output metrics into their input metrics
Once you’ve identified your key output metrics, build out the constellation by breaking those outputs down into their input metrics. Drill down until you’ve got a set of actionable input metrics that you can impact directly, and then build your experiments to move those.
Although input metrics are actionable, they don’t always drive improvements in output metrics. You need to be willing to discard them quickly if after some experimentation you find moving them doesn’t improve the output metric. The inputs that successfully improve the output metric are the leading indicators that you need to identify as quickly as possible.
3. Understand and monitor your tradeoff metrics
The next step is to look at the full constellation of metrics, figure out the relationships between them, and identify tradeoff metrics. Because many metrics are interdependent, for every metric you try to improve, determine where in your business you are likely to see a counter-reaction. Then, work to find a healthy balance between your opposing metrics.
Once you’ve worked through this 3-step process and built out your constellation of metrics, get ready to adapt your growth model. As the business grows and changes, you may need to focus on different areas, which may require new input and output metrics.
At the end of the day, this constellation of metrics reflects the health of your business, whether you track it or not. It’s good to simplify and focus as much as you can, but remember you’re never going to find a silver bullet metric, so be sure to zoom in as you experiment, and zoom out as you take a step back to look at your whole ecosystem of metrics.
If you’d like to learn more about how to choose the right metrics to track for your business and build a systematic approach to growth, consider applying for our Growth Series or the Retention + Engagement Series.
Get More Essays on Growth, One Email Per Post.
More About the Authors

Brian Balfour is the Founder & CEO of Reforge and was previously the VP Growth @ HubSpot. Prior, he was an EIR @ Trinity Ventures and founder of Boundless Learning (acq by Valore) and Viximo (acq by Tapjoy). He advises companies including Blue Bottle Coffee, Gametime, and Help Scout on growth.

Shaun Clowes is the VP of Product at Metromile and was previously the Head of Growth at Atlassian. His approach to growth focuses on activation and retention with an emphasis on the thinking, processes and discipline necessary to grow through product features and engagement.

Casey Winters is an EIR at Greylock Partners. Previously, he was a Growth Lead at Pinterest and GrubHub. He advises companies including Tinder, Eventbrite, Reddit, and Pocket on scaling and growth, specializing in retention and engagement.

Comments